Win by Not Losing
When I was finishing last month’s newsletter, the war in Iran was just beginning. We are going into week five, and the turbulence has been rough. I tend to have an optimistic outlook on most things in life, including client portfolios this year. We were up so much in January and February that the big pull back in stocks in March wasn’t as bad as it could have been. If you recall, I mentioned last month that at some point the Core Strategy would have a down month, and it happened in the month of March. It’s hard to remember that the last negative month was December of 2024, which was 15 months ago.
The Core Strategy was down -7.54% for the month of March, but fortunately, we were up slightly more than that through the end of February. The net result is +3.43% through the first quarter, which is great when you compare it to the S&P 500, which was down -4.37% year-to-date, and the 60/40 (stock/bond) Index, which was down -1.73% for the first quarter of 2026. While past returns aren’t a guarantee of future results, the goal is always the same, to “win by not losing.”
Friends of mine at Sound Mind Investing created the graph below.1 The upward sloping line is a picture of the S&P 500 stock index from 1962 to the present. (The graph is logarithmic, meaning it shows price changes in percentage terms rather than dollar terms.) To focus on the big picture, it’s been smoothed out to eliminate fluctuations of less than 20% (bear markets are commonly defined as selloffs of 20% or more).
On the graph, they added dots indicating 16 events that created great turmoil in U.S. and world affairs. These “crises” were primarily triggered by either political or economic factors. On each occasion, fear was widespread. The emotional atmosphere was similar to what we experienced last year following the tariff announcements, but often much worse.
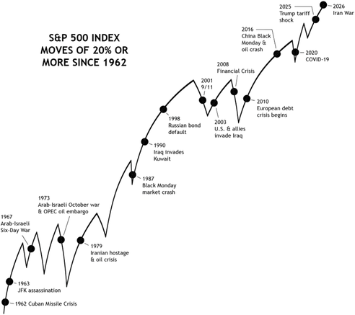
Here are three lessons learned from this bit of history:
Periods of sustained weakness are going to happen, but are relatively rare. Bull markets run further and last longer than bear markets. Your investing game plan should take this fact of market history into account. The long-term investor should look at periods of weakness as temporary buying opportunities rather than sell signals.
During your wealth-building years, it pays to stay invested in stocks. Reflecting the strength of the U.S. economy, stocks have been — through wars and crises of many kinds — on a long, upward march for decades. Looking at the overall value of your holdings on a weekly/monthly basis is to be avoided. It fosters emotional decision-making. The decisions of successful investors are driven by the mind rather than the heart.
“Crises” typically have only a temporary dampening effect (if any) on stock prices unless they directly affect the profits of corporate America. The current situation is a good illustration. The past few years have seen dramatic events between the U.S., Israel, and Iran. Yet to this point, none of this has had a negative impact on corporate profits or the U.S. stock market. Only two of the events marked on the graph occurred near the beginning of a bear market (the 1973 OPEC oil embargo and 2008 Global Financial Crisis) and consequently had significant short-term implications for the U.S. stock market.
The current Iran situation is still unfolding, and we don’t know where it might lead. It’s possible a prolonged shutdown of the Strait of Hormuz could eventually have the type of longer-term economic impact that does impact U.S. corporate profits and the stock market.
But don’t let short-term fears undermine your long-term confidence. Today’s news is tomorrow’s history, and it will soon pass. A long-term investing plan you can stick with will steady your hand, and you’ll be less likely to go off course when the headlines turn scary for a season.
WHERE DO I THINK THE STOCK MARKET IS GOING?
I think the stock market is setting up for a big bounce. The most likely catalyst for this will be a ceasefire, or some kind of negotiations breakthrough between the U.S., Israel and Iran. The sell off is similar to last year’s tariff sell off. Stocks were down double digits in April, and then when President Trump announced the 90-day pause on tariffs on April 9, the S&P 500 rose 9.50% and the Nasdaq jumped 12.20%.
The President initially said it would be a 4–6-week war and we are in week 5. I don’t believe Trump wants to get into a pro-longed war with “boots on the ground. ”Either Iran will come to the peace table, or the US will finish destroying all the targets we want to take out and declare it over. Either way, the stock market should respond favorably. The issue of oil getting through the Strait of Hormuz will likely continue.
As I mentioned at the beginning of 2026, I believe we will have double-digit returns in the stock market this year, but not without a lot of volatility. President Trump is in his second term and could lose the House and/or Senate majority in November, which might lead to more initiatives on his part before then. I’m sure liberating Cuba is a possibility, which would cause market fluctuations as well. As noted above, taking the long view is important here.
WHERE IS GOLD GOING NEXT?
To try and determine where gold prices will go next, you need to consider some of the factors that impact the price of gold. Three of (these factors are inflation, instability, and economic uncertainty.
Inflation is the change in prices of goods and services, and is one of the most significant drivers behind gold prices. When inflation rates are high, our dollars don't go as far as they used to, so we have less purchasing power. As a result, investors put more money into gold since its supply is finite. Gold prices tend to spike during periods of high inflation.
For example, in 2019, the inflation rate was under 2%, and the price of gold was about $1,392. Inflation skyrocketed, surpassing 9% in 2022. Gold prices also increased, reaching $1,800 per ounce — an increase of about 29%.
Geopolitical instability issues affect gold rates. Events like wars, higher tariffs, or trade disputes can trigger surges in gold prices. When the global economy is uncertain, investors turn to gold as a form of financial security.
Economic uncertainty like recessions, stock market fluctuations, and higher unemployment rates can make investors nervous about traditional banking and investment products. They often turn to gold as an alternative investment because it has historically held its value.
No one can say for sure how gold will perform in the future and the idea of gold reaching $6,000 seemed like a far-off dream. But due to increased central bank buying and global tensions, JPMorgan forecasts that gold will reach $6,300 per ounce in 2026. The same analysts laid out a case that gold could even reach $8,000 an ounce.2
I have received a lot of questions in regards to the best time to sell gold. For those that have been clients for a few years, we originally bought gold on March 1st of 2024. For the remaining 10 months of that year, gold was up 27.54%. Then in 2025, we held gold for the entire year, and it was up 46.83%. For the first two months of 2026, it was up 22%, then it gave back -11.01% in March to still be up 9.98% year-to-date. If you just looked at your statements quarterly, you’d say, “Wow! Gold’s up 6.72% in three months, that’s awesome!” Just some positive context for you.
On a personal level, I feel that the three factors I mentioned above; inflation, instability, and economic uncertainty, are not going away under the Trump Presidency. Therefore, it’s likely we will be in gold a while longer. Fortunately, we have an unemotional investment system in TARS, that will indicate to us when to exit. I don’t need to guess.
Just like I use the terminology, “win by not losing,” I also say, “the trend is our friend.”Momentum investing is based upon moving into and out of asset classes, sectors, or countries, based upon the trend-lines up and down. At some point we will get a clear direction on when to exit.
REVIEW - UPDATE TO THE CORE TARS
Normally, when U.S. Stocks are in the top 3 of our 6 options reviewed month, we use SPY (S&P 500 index ETF). In the middle of 2023 through 2025, I utilized SPYG instead of SPY.
The S&P 500 Growth ETF (SPYG) places a heavier weighting on technology stocks like NVIDIA, Microsoft, Google, Meta, and Broadcom. From a return standpoint, this resulted in 5-10% better returns each year. No asset class lasts forever, which is why we are dynamic in our investing as opposed to “buy and hold.” What has been born out in the past 1, 3, and 6 months returns, is that Small Cap Value stocks have rotated into favor over Large Cap Growth.
The new update to the Core Strategy, is that when we evaluate the 6 ETFs to determine the 3 we will be in, if SPY (S&P 500 index) is one of the 3, then there will be a further review of the best sub-set of US stocks to invest in. The 4 funds in this sub-set will be IWO for small/growth, IWN for small/value, IWF for large/growth, and IWD for large/value.
For those in the Conservative, Moderate Conservative, and Moderate allocations, we will invest 50% in SPY and 50% in whichever of the 4 sub-set funds is the momentum leader. For Moderate Aggressive and Aggressive allocations, we will invest 100% in the momentum leader of the sub-set funds.
Beginning in February the change will look like this:
Conservative/Moderate Conservative/Moderate Strategies: Sell SPYG, Buy 50% SPY & 50% IWN.
For Moderate Aggressive/Aggressive Strategies: Sell SPYG, Buy IWN.
TACTICAL ASSET ROTATION STRATEGY (TARS) RESULTS
The Core ETF Strategy is comprised of SPY (S&P 500), EFA (International), VNQ (Real Estate), IAU (Gold), IEF (7-10 mo. Treasuries), and BIL (Cash) and are evaluated on a relative strength basis and re-ranked 1 through 6. Clients are in the top 3. Typically, the CORE makes up 30% of a client portfolio. The Core TARS portfolio is designed to share in some of the bull market’s gains, while minimizing (or even preventing) losses during bear markets. “Win by not losing.”
TARS Core had an amazing 10.91% run up from the beginning of the year through the end of February. My hope was that despite the big downdraft in stocks from the war, we would end up at the end of March at least even then, we could regroup for the rest of 2026.
As I alluded to in the beginning section of the newsletter, ‘Where do I think the market is going?” it only takes a few words or action by the President to cause a big bounce in the stock market. This was the case on the last day of March as the Dow rose 1,125 points after the Iranian President, Masoud Pezeshkian, signaled the regime may be willing to negotiate an end to the war. The sentiment seems to be continuing to start the month of April and could reverse quickly the other way depending upon circumstances. But, when the actual end arrives, stocks seem to be set to soar.
Conservative, Moderate Conservative and Moderate portfolios were 50% in SPY (S&P 500) and 50% in IWN (Small Cap Value) and Moderate Aggressive and Aggressive portfolios went 100% into IWN. The former were down -7.73% for the month and the later were down -7.54%. After such big run ups for Gold (IAU) and International stocks (EFA) through February, they were kind of set up for a pull back. The war starting certainly didn’t help. Year-to-Date the Core Strategy is up 2.78% for Conservative, Moderate Conservative and Moderate portfolios and up +3.43% for Moderate Aggressive and Aggressive portfolios. That compares to the 60/40 Index down -1.73% YTD and the S& P 500 Index down -4.37%.
The short explanation behind Gold plummeting -11.01% in March, is largely two-fold. First, it was a victim of its own recent success, having been so strong in the months leading up to the war. In fact, even after pulling back -11% during March, gold is still up +45% over the past year. When volatility spikes and investors get nervous, it's common for them to sell big recent winners and lock in some of those profits.
Another factor likely driving gold's sharper than expected drop was the nature of its run higher in recent years.
Since 2022, a key driver in gold's ascent has been strong, consistent buying by foreign countries and their central banks. These reserves are basically the "savings accounts" of these countries. March represented the proverbial "rainy day" for many of these countries, who were suddenly faced with soaring energy bills, and in the case of the Middle Eastern countries, their incoming revenues from energy exports grinding to a halt. No surprise, then, that there has been speculation that these countries and central banks were selling gold—essentially dipping into their "rainy day" savings accounts. A third factor — sharply higher interest rates — weighed on gold's March performance as well.
THE CORE STRATEGY
Here was the performance of the three Core asset classes for April1
US Stocks (SPY) - 4.93%
Small Cap Value (IWN)** -3.77%
International (EFA) - 7.83%
Gold (IAU) - 11.01%
*Conservative, Moderate Conservative & Moderate allocations hold 50% SPY and 50% IWN.
**Moderate Aggressive & Aggressive allocations hold 0% SPY and 100% IWN.
There are no changes for March.
SECTOR ETFS
The TARS Sectors that are chosen based upon the same momentum strategy as the Core ETFs. I evaluate 85 Sectors and we make changes if they fall out of the top quartile.
Biotechnology did quite well this month with a late surge and ended up +0.28%. Surprisingly Aerospace & Defense (PPA) fell -8.46%. for Aggressive Portfolios. With a war going on it would seem that defense stocks would do well. It’s possible that there was profit taking in this sector, but as I look at stocks today (April 1st) PPA has rebounded +3%. Not surprisingly, Energy stocks have shot up into the top quartile, but Biotech and Defense have not dropped enough to take them out of the top quartile. I will be watching the trend/momentum closely in April.
Here is the performance of the Sector ETFs for March3
Biotechnology (IBT)* - 0.28%
Aerospace & Defense (PPA)** - 8.46%
*Moderate & Moderate Aggressive allocations hold IBT
** Aggressive allocations hold PAA
There are no changes for March.
WORLD ETFS
I evaluate 64 country and world ETFs. Aggressive portfolios hold a 5% allocation to 2 country ETFs and Moderate Aggressive have a 2.5% allocation each.. Both country ETFs performed in-line with the S&P 500 for March and remain in the top quartile.
Here is the performance of the World ETFs for April4
Spain (EWP) - 5.12%
Latin America (ILF) - 2.63%
There are no changes for March.
OTHER FUNDS
VYM continues to be a consistent performer and is doing exceptional well this year, up +3.96% YTD. It is not surprising that the Aegis Small Cap Value fund (AVALX) is doing well, seeing as the Core Strategy had us move out of Large Cap Growth and into Small Cap Value. YTD it is up +11.60%.
Here is the performance of these funds for March3
Vanguard High Dividend Yield Stock Fund (VYM)* - 3.92%
Aegis Small Cap Value (AVALX)** - 2.56%
*Conservative, Moderate Conservative, Moderate & Moderate Aggressive allocations hold VYM.
** Moderate Aggressive & Aggressive allocations hold AVALX.
FIXED INCOME ETFS
PAAA (PGIM’s AAA Ultra Short Bond Fund) makes 20% of Conservative allocations, 10% of Moderate Conservative and Moderate allocation, and 5% of Moderate Aggressive allocations. It has a current yield of 5.12%. FLOT floating rate has a 10% weighting in Conservative allocation. PIMCO’s PFN ETF has been swapped out for a less volatile PIMCO Mutual Fund – PIMIX.
For Moderate Conservative and Moderate allocations, FLOT has been swapped out for the Guggenheim Macro Opportunities Fund (GIOIX). For those in non-retirement accounts where we are seeking to limit taxable income, I have substituted the Short-term Nat’l Muni (SUB), North Square Tax-Advantaged Professional Income (QTPI), and PGIM Ultra Short Muni (PUSH).
Here is the performance of the fixed income funds in March3
PGIM AAA Ultra Short Bond (PAAA) + 0.20%
PGIM Short Term Muni (PUSH) - 0.37%
Short-term Nat’l Muni (SUB) - 0.66%
Invesco Floating Rate (FLOT) + 0.22%
Guggenheim Macro Opportunities (GIOIX) - 1.12%
PIMCO Income (PIMIX) - 2.45%
North Square Tax-Advantage Income (QTPI) - 1.46%
ALTERNATIVE HOLDINGS
The JP Morgan Equity Premium fund (JEPI), writes covered calls on S&P 500 holdings for additional premium returns yields 8.06%. Real Asset Allocation (RAA) is a diversified asset allocation fund that utilizes the same relative strength strategy as our Core Strategy with the inclusion of not just stocks, bonds, and gold, but commodities, metal miners, managed futures, Bitcoin, TIPS, Emerging Market Bonds, and more. RAA is currently 10-20% of every risk strategy. This year I also added a Commondities Fund to the Aggressive Growth allocations as a hedge against volatility. That asset class was the big winner for March +11.64% and Year-to-Date +22.52%.
Here is the performance of the alternative funds in March3
Real Asset Allocation (RAA)* - 3.98%
JP Morgan Equity Premium (JEPI)** - 4.78%
SummerHaven Dynamic Commodity (SDCI)*** + 11.64%
*All portfolio allocations hold RAA
**All portfolio allocations except for Aggressive hold JEPI
***Aggressive Growth allocations hold SDCI
REFERENCES
Sound Mind Investing, “A Market History Lesson: Crises Are More Common Than Bear Markets,” by Mark Biller * Austin Pryor, Mar 26, 2026
. JPMorgan raises Gold forecast to $6,300, makes case for $8,000. Analysis FXStreet.com, Mike Maharrey,Feb. 22, 2026
. Morningstar March 31, 2026 Monthly Returns.
DISCLOSURES
The analysis and commentary in this Market Commentary is general in nature and does not take your personal circumstances into consideration. It is not intended to be a substitute for specific, individualized financial advice and investors should obtain legal, accounting and tax advice from a qualified tax professional, accountant or attorney.
The information provided in this Market Commentary, including any strategies, methodologies, and opinions, is expressed as of the date hereof and is subject to change. EverSource Wealth Advisors, LLC assumes no obligation to update or otherwise revise these materials.
This Market Commentary relies upon historical data, and much of the information presented is not intended to be performance reporting or representation, whether hypothetical or actual. Reports on the performance of various strategies are gross, not net, and do not take into account our fee or various third-party charges such as trading charges. Individual Exchange Traded Fund (ETF) performance in the commentary are monthly returns of all ETFs utilized across client accounts in various asset allocation percentages based upon risk tolerance. They are gross returns and not net of advisory fees. Each client’s returns will vary based upon the percentage of each ETF held, in addition to other variables, such as: allocations to money market funds, additional individual stocks or mutual funds held, and date of entry into each holding.
Actual results will vary from the analysis. Past performance should not be taken as an indication or guarantee of future performance, and no representation or warranty, expressed or implied is made regarding future performance or the accuracy of the information herein.
This material is provided for informational purposes, is intended for your use only, does not constitute an invitation, solicitation, or offer to subscribe for or purchase any of the products or services mentioned. It is likewise not a recommendation that you purchase, sell, or hold any security or other investment or pursue any investment style or strategy.